1
2
3
4
5
6
7
8
9
10
11
12
13
14
15
16
17
18
19
20
21
22
23
24
25
26
27
28
29
30
31
32
33
34
35
36
37
38
39
40
41
42
43
44
45
46
47
48
49
50
51
52
53
54
55
56
57
58
59
60
61
62
63
64
65
66
67
68
69
70
71
72
73
74
75
76
77
78
79
80
81
82
83
84
85
86
87
88
89
90
91
92
93
94
95
96
97
98
99
100
101
102
103
104
105
106
107
108
109
110
111
112
113
114
115
116
117
118
119
120
121
122
123
124
125
126
127
128
129
| import * as echarts from '../ec-canvas/echarts';
import * as liquidFill from '../ec-canvas/echarts-liquidfill.min';
const app = getApp()
Page({
data: {
ec_dispace_charts: {
lazyLoad: true
},
},
onLoad: function () {
// 获取组件
this.ecComponent = this.selectComponent('#dispace_charts');
this.initCharts(0.7);
},
initCharts: function (value) {
this.ecComponent.init((canvas, width, height, dpr) => {
// 获取组件的 canvas、width、height 后的回调函数
// 在这里初始化图表
const chart = echarts.init(canvas, null, {
width: width,
height: height,
devicePixelRatio: dpr // new
});
let data = [value, value, value, ];
chart.setOption(setOption(value, data));
// 将图表实例绑定到 this 上,可以在其他成员函数(如 dispose)中访问
this.chart = chart;
// 注意这里一定要返回 chart 实例,否则会影响事件处理等
return chart;
});
}
})
function setOption(value, data) {
const option = {
title: {
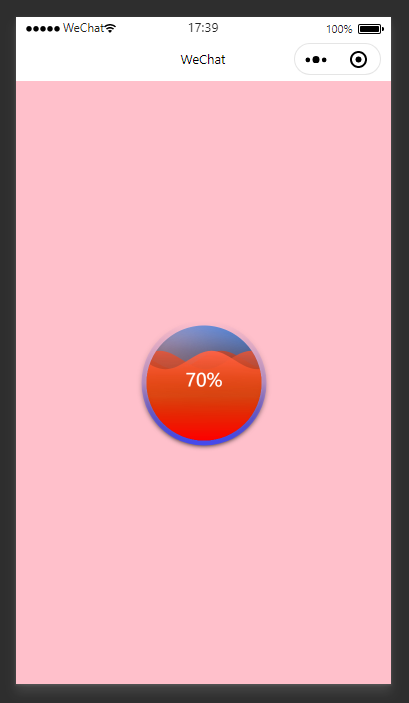
text: (value * 100).toFixed(0) + '{a|%}',
textStyle: {
fontFamily: 'Microsoft Yahei',
fontWeight: 'normal',
color: '#fff',
rich: {
a: {
fontSize: 18,
}
}
},
x: 'center',
y: '40%'
},
series: [{
type: 'liquidFill',
radius: '80%',
center: ['50%', '50%'],
// shape: 'roundRect',
data: data,
backgroundStyle: {
color: {
type: 'linear',
x: 1,
y: 0,
x2: 0.5,
y2: 1,
colorStops: [{
offset: 1,
color: 'rgba(68, 145, 253, 0)'
}, {
offset: 0.5,
color: 'rgba(68, 145, 253, .25)'
}, {
offset: 0,
color: 'rgba(68, 145, 253, 1)'
}],
globalCoord: false
},
},
outline: {
borderDistance: 0,
itemStyle: {
borderWidth: 5,
borderColor: {
type: 'linear',
x: 0,
y: 0,
x2: 0,
y2: 1,
colorStops: [{
offset: 0,
color: 'rgba(69, 73, 240, 0)'
}, {
offset: 0.5,
color: 'rgba(69, 73, 240, .25)'
}, {
offset: 1,
color: 'rgba(69, 73, 240, 1)'
}],
globalCoord: false
},
shadowBlur: 10,
shadowColor: '#000',
}
},
color: {
type: 'linear',
x: 0,
y: 0,
x2: 0,
y2: 1,
colorStops: [{
offset: 1,
color: 'rgba(255.0,0,0)'
}, {
offset: 0.5,
color: 'rgba(266, 69, 0,.5)'
}, {
offset: 0,
color: 'rgba(255, 99, 71,1)'
}],
globalCoord: false
},
label: {
normal: {
formatter: '',
}
}
}]
};
return option
}
|